
Satellite Crop Monitoring: Cropio
After researching the service providers and choose the most popular and advanced service provided by Cropio; although, we do not claim it is the best service. Our goal was to find a company with a large number of users and that provided maximum functionability in order to assess the full potential of the satellite crop monitoring technology.
General information about the company
N.S.T is an agriculture-directed company with R&D and processing centers in the US and Eastern Europe. Founded in 2008, N.S.T. is a developer and integrator of its core product, Cropio – field management and vegetation control system that enables its users to efficiently plan and carry out agricultural operations.
Service set up
The first barrier we met was the absence of a credit card payment option, which is quite unusual for online services.
We sent a formal request and received a license agreement to satisfy our inquiry, signed it and sent back. We expected there to be an “Agree” button on the site – it is easier and more convenient.
…no equipment or installation is required. It is as simple as login and password…
It was unexpected, but user-friendly that no installation was required! We just received a login, with password and we are inside the system.
We followed instructions and entered the coordinates of our fields into the system. There are two options: either to download shape files (they list accepted formats – this process is quite lengthy, and I believe, it includes all or at least all popular formats), or you can use Google maps to outline your fields. We used the second option, as we had only 25 fields and outlining the fields in Google maps intuitively looks like an easier option; however, if you have over 100 fields downloading shape files will be fastest method of uploading your fields.
Next we downloaded an excel template for historical information, filled in data and uploaded back into the system. Actually, setting up the system took us less time than the service request and signing the licensing agreement.
For managers or owners
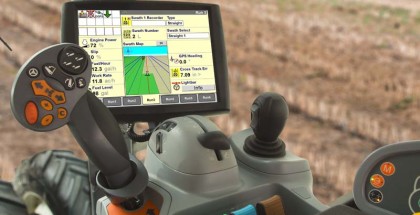
After system set up, we landed on the Monitoring Center page, where we could see the structure of crops and a nice map with all our fields pained in different colors – indicating different level of vegetation on the fields.
We found a very useful feature – when you click on particular crop – there is a drop down list of our fields with selected crops plus all the other fields; at the same time fields with selected crops are shadowed on the map – as result we can easily select fields with particular crops, see where they are located and sort them based on the level of vegetation – very impressive.
There is an “Expected Yield” column that is empty by default – the highlighted instructs us to go to each individual page and input yield expectation based on the information from “Forecast Assistant”. We did so (yield assistant is a page where vegetation graph of particular field is compared to the historical vegetation graphs of the same crop on the same or similar fields, you use the graph that is close to the current year’s pattern and select its yield as expected); of course you can adjust the data as necessary to – but we chose the simplest option just to get a feel for how it works.
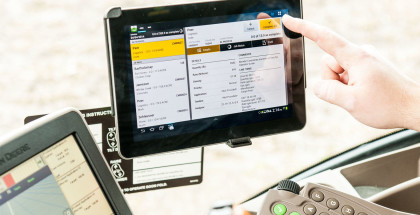
…check your crop structure and harvest value at any time…
After entering the basic information, the Monitoring Center orients itself: at any time you can log in and see the condition of your crops and the current value of your harvest. It is especially convenient when agronomists prepare a forecast and the owner or CEO can access the information online.
We found that function very useful for the farmers and companies, which allows for business decisions (forward sales, insurance, cash management) and production decisions to be carried out by different people. Ideally, this should help to avoid situations when the CEO or Manager is surprised by harvest conditions on particular fields and agronomist say that it was expected and it was previously noted that the yield would be low.
For agronomist
Then we moved to the Crop page – the page is more focused on the agronomist: this page is divided into crop sections and in each section for each particular, crop we have information specific to the current status of the crops on fields and one week change. All fields are automatically sorted by the level of vegetation allowing us to detect non-performing fields.
…excellent tools for risk management of non-performing zones…
In the help section we found more details on how to use the information: to be brief – during the growth stage we take the short reports, select the fields with low levels of vegetation and check what is wrong and what can be done to improve the situation; if fields are in a mature stage – go and check fields with high level of vegetation as it could keep sided vegetation or fields could not be ready to harvest. When planning a harvesting campaign – double check the corn moisture level on the fields with higher vegetation and in any case put those fields in the last row to harvest.
In general, it looks very helpful, especially in terms of risk management of non-performing zones and for planning harvesting campaigns.
Field measures
Next step – we moved to the level of individual fields – quite a lot of information there (can not imagine how they get all those specifications for our fields) but we list it, as different measures could have a different level of priority to different users:
-
- crop;
- variety;
- sowing date;
- crop rotation;
- field history;
- other;
-
- historical vegetation (up to 10 years);
- average field vegetation;
- detailed field vegetation;
- field zoning;
- non-performing zone detector;
-
- soil moisture;
- soil temperature;
- field zoning;
- soil test optimizer;
- relief and drainage maps;
-
- precipitation;
- dew points;
- temperature (air and soil);
- snow cover;
- 10 days individual field weather forecast;
- private weather stations integrator;
A couple of words about the data. It looks like the highest resolution for the pictures is 15X15 – the image is very detailed, stripes are distinguished well. At the same time, the provider claims additional pictures with higher resolution can be acquired for additional cost – we did not explore the opportunity, as existing picture resolutions appeared more than sufficient.
We found excessive amount of information allocated to the individual field and even cannot imagine what else is required for operational decisions.
…soil moisture on different depth…
Soil moisture – we have different levels of moisture on three depth measurements which is great, but at the same time the data is taken from the satellite with picture resolution of 10 km! In any case it is more precise than to obtain such information from a public weather station with an average coverage of 50 miles in the USA.
We also discovered the option to Integrate Your Weather Stations – where you can choose the vendor provider of you private weather station and integrate it into the system – we do not have one and therefore did not use that option.
Weather forecast is conducted based on individual field GPS coordinates – this is very convenient.
On Vegetation page we found a detailed vegetation graph compared with average and historical vegetation for the same crop. Actually, it is almost the same information as we used in Forecast Assistant. On the page you can clearly see how a particular field is performing compared to the fields with the same crop in the current season and with past performance on the same field.
…track how your field is performing compared to other fields and average…
The field task page gives the possibility to create files for VRA based on the level of vegetation. It looks very simple – you need to select a grid (depending on the VRA equipment) and save file in appropriate format. We did not have the possibility to test it and left it for the next review.
As well we identified such options as weather and vegetation history, automated report generation, field record card and other functions which we did not managed to utilize without customer support.
Finally, it is important to point out the very helpful Field data page where you can easily select fields with a particular crop, area, certain level of vegetation. To sort all fields based on vegetation level and other very convenient views.
by Edward Stone for Agricultural Review
Review Overview
Easy to use
9Quality of images
7.5On field measures
10Agronomist tools and recommendations
9Management tools
9Related Posts
Tech in the Field February 9, 2014 | Andre Garnon
3-D printing technology: impact on agriculture... October 4, 2013 | Andre Garnon

Remote management by John Deere: AgLogic December 5, 2017 | Andre Garnon
Cropio: Field recording service August 15, 2013 | Andre Garnon
More precision ag tools from John Deere April 6, 2016 | Andre Garnon
-
My name is Diogo, I am a Agronomist from Brazil, I`d like to try the app, is it possible to get a login and passcode for a short time trial.


Comments