
Tech in the Field
For 23 years, the Farm Journal Test Plots’ mission has been to provide third-party, independent research straight from the field. Hands-on experience keeps Farm Journal Field Agronomists Ken Ferrie and Missy Bauer, along with their crews, up to speed with technology. The crew has had many milestones throughout the years, including installing the first guidance system in the U.S. Here’s a roundup of the tools used for the first time in test plots this past year.
Data Points
All of the Farm Journal Test Plots are field-sized efforts that use standard machinery to enable our studies to be replicated by farmers with similar equipment. That said, the plots are harvested after the test plots crew diligently calibrates the combines’ yield monitors. Every replication is recorded using grain carts outfitted with scales.
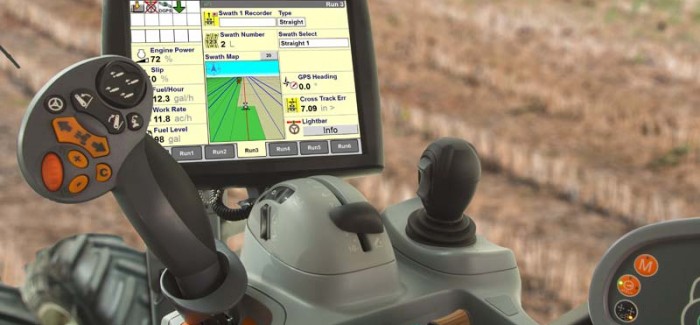
The test plots crew had access to two new yield monitor technologies in 2013.
The John Deere calibration process now requires four to six loads to train the monitor to identify various flow rates.
“Any time you enter into site-specific farming, you need to know the difference in yield throughout a field and where in the field those bushels came from,” says Isaac Ferrie, who works in the plots. “Making sure you are using a highly precise yield monitor is key.”
Precision Planting’s YieldSense uses a different location for the flow sensor than other models. The grain is measured as it comes up the clean grain elevator, a compact area that forces a higher percentage of grain against the sensor.
“The YieldSense requires a one-load set-up process,” Ferrie says. “It has the ability to sync an iPad with the monitor and continually uploads yield data to the cloud, viewable anywhere with access to a Internet connection. Also, you can use its split screen. If you record all planting data with the 20/20, you can compare planter performance to yield.”
Harvest Helper
 |
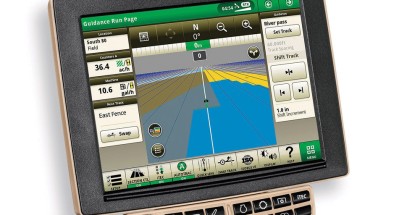
The UHarvest touchscreen automatically logs each grain cart load in the system. |
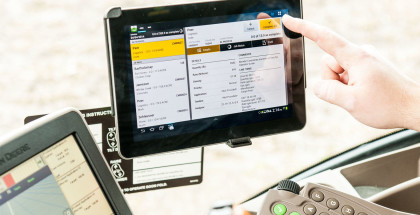
The Illinois test plots crew had the chance to exclusively test Unverferth’s latest grain cart system in the field before it was commercially available. The UHarvest data management system was used on an iPad.
In partnership with Raven, the system provides easier data tracking. The AccuSave technology also features a drivetrain sensor attached to the cart to allow each load to be automatically recorded for data accuracy without the need for operator intervention.
“Every test plot is harvested with a calibrated yield monitor and weigh wagon,” explains Isaac Ferrie, who works in the Illinois test plots. “We collect a lot of data. With this system, you are able to view weight on the cart from any mobile device, as long as you are within the Wi-Fi signal, so you can view the cart weight from a combine or semi. Then, every time we unload, it automatically creates the load and stores the moisture and weight you unloaded.”
Harvest data can be downloaded from the processor’s USB port to a thumb drive and stored on a computer or uploaded to a secure Raven Slingshot web-based server where it can be viewed by other trusted parties.
Accuracy Simplified
 |
Used on a New Holland T8 tractor, the CenterPoint RTX system allowed the test plot crew in Michigan to go from field to field without setting up an RTK base station. |
The Farm Journal Test Plots have had access to every automated guidance system on the market for the past 23 years. The crews in Illinois and Michigan use precision ag technologies to plant, sidedress and harvest thousands of acres.
For the first time this year, we used the CenterPoint RTX system on a New Holland tractor for spring planting and fall tillage.
“The main advantage of the CenterPoint RTX is that it’s satellite based so we can receive RTK accuracy levels without a base station,” says Farm Journal Associate Field Agronomist Missy Bauer. “If possible, we prefer to plant with RTK level accuracy because having that level of preciseness helps in our research.”
Bauer reports that the CenterPoint RTX was a very reliable signal and the same quality of accuracy as traditional RTK.
Quicker Nutrient Calculations
 |
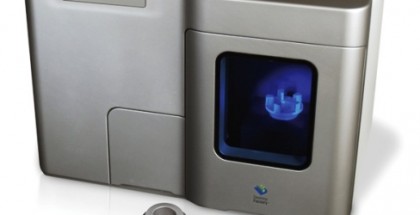
For more timely nitrate results, the Illinois test plots crew evaluated the new Redshield SoilSens. |
Measuring nitrates in the soil gives farmers an idea of the amount of nitrogen available to the crop. The Redshield SoilSens provides in-field testing and nitrate results quicker than sending samples to an off-site lab. The test plots crew in Illinois took samples from multiple fields and used the system for analysis. The system detects the level of nitrate ions available from the soil through moisture.
“We pulled the sample, put it in the test cup and ran the analysis in about five minutes,” says Isaac Ferrie, who operated the mobile unit. “The system runs on either 110- or 12-volt power, so it can go in the back of the pickup or easily plug in at the shop.”
He explains that improper handling and shipping of nitrate samples can cause variance in results, and a mobile unit could result in more consistent measurements of nitrate without the hassle of shipping.
For comparison, the lab results were not available at press time. But we’ll continue to test and report on soil-testing technologies.
Mobile Measurements
For the second year, the test plots have used thermal imaging as a mapping service to provide a better picture of the crop in-season.
“Thermal imagery measures the crop temperature. For plants that are stressed due to insects or disease, the ability to regulate their own temperature is diminished, and those plants will appear warmer,” explains Isaac Ferrie, who works in the test plots. “In the thermal imagery we are using, we can measure differences down to a few hundredths of a degree. We can also pick up insect and disease infestations earlier than other aerial imaging products.”
For scouting, the crew uses a new app, ACRE Scout, to bring up the thermal image on a GPS-enabled iPad out in the field.
“This is a huge aid in scouting to ensure you are getting to the right spots as it navigates you to troubled areas in the field,” Ferrie says. “It can be used with any image. For example, you can use an older yield map or application maps throughout the year.”
Row by Row
 |
The test plots crew in Illinois used the Yetter 2940 Air Adjust system to fine-tune row cleaner settings in the field. |
To manage a range of seedbed conditions, the age of row-by-row control of not only your planter but also the planter attachments has arrived.
“Farmers realize there is variability in the planting conditions from day to day and field to field,” says Farm Journal Field Agronomist Ken Ferrie. “Technology has made setting the planter for field conditions easier in that no longer do farmers have to set row cleaners by trial and error for complete passes.”
For example, in 2013, the test plots crew used the Yetter 2940 Air Adjust system.
“You can adjust the row cleaner aggressiveness from the cab to set the amount of lift or the amount of down pressure,” Ferrie says. “It takes just second to adjust the whole planter, and you can more accurately fine-tune the settings while on the go to find the sweet spot.”
Ferrie notes that without the system, it might take a farmer two or three rounds to calibrate the setting just right.
To install the attachments, a compressor for the system has to be mounted and air lines run and checked for leaks.
In the field, correctly setting the row cleaners ensures even depth and leads to more even plant emergence.
“It’s important for row cleaners to be path makers and keep the residue out of the slot,” Ferrie says. “If stands are reduced 1,000 plants here and there, that can add up to 7 bu.”
Ferrie advises farmers that any time you add an attachment to the planter, you should consider how it might affect the metering unit.
“Always dig behind your planter so that you have confidence in how the planter is performing with a new attachment.”
Nitrogen in New Ways
 |
To apply in-season nitrogen, the Y Drop system can be mounted on sprayers to precisely place nitrogen 2″ to 3″ from the row. |
The test plots focus hundreds of acres on nitrogen management every year, and learning more about timing, placement, rate and product drives many of the crew’s in-field efforts.
Looking at new placement technologies in-season, the Illinois crew used the Y Drop system from Ag Alternatives. The Y Drop can mount to any sprayer and places liquid nitrogen product within 2″ to 3″ of the row.
“When you look at the system, many are skeptical that it would break off the crop, but we saw no damage in the field after application,” says Brad Beutke, who ran the applicator. “It was also no issue in transport when the boom was folded.”
Once the universal mounting kit is installed, the
Y Drop system can be removed and replaced in 15 minutes. Mounted to an Apache sprayer, the crew used the system in two plots in 2013.
“In the two plots, we used the same protocol and compared the Y Drop to sidedressing with a toolbar and traditional drop nozzles at the same timing. You could go later with Y Drop, but in our first-year studies, we wanted to compare placement—not timing of the application,” Beutke says.
The test plots crew plans to continue to include the system in the future. Beutke says: “Another advantage to this system is speed and working width. The typical sidedress bar we use is 40′ compared with a 60′ spray boom. The Y Drop system claims it can be run up to 15 mph.”
(Source: http://www.agweb.com/farmjournal/article/tech_in_the_field_NAA_Margy_Eckelkamp/)


Submit a Comment